
OPENMAP · USE CASES
The world first 3D Map for Business Presentation
From property decisions to regional infrastructure, Openmap helps teams turn places and location data into visual stories they can explore and share. Put important sites, routes, and surrounding context on one interactive 3D map.
REAL ESTATE & PROPERTY DEVELOPMENT
Show a property in its wider context
Help buyers, tenants, investors, and development teams evaluate a site in context. Bring the project, surrounding places, and the routes between them into one explorable view.
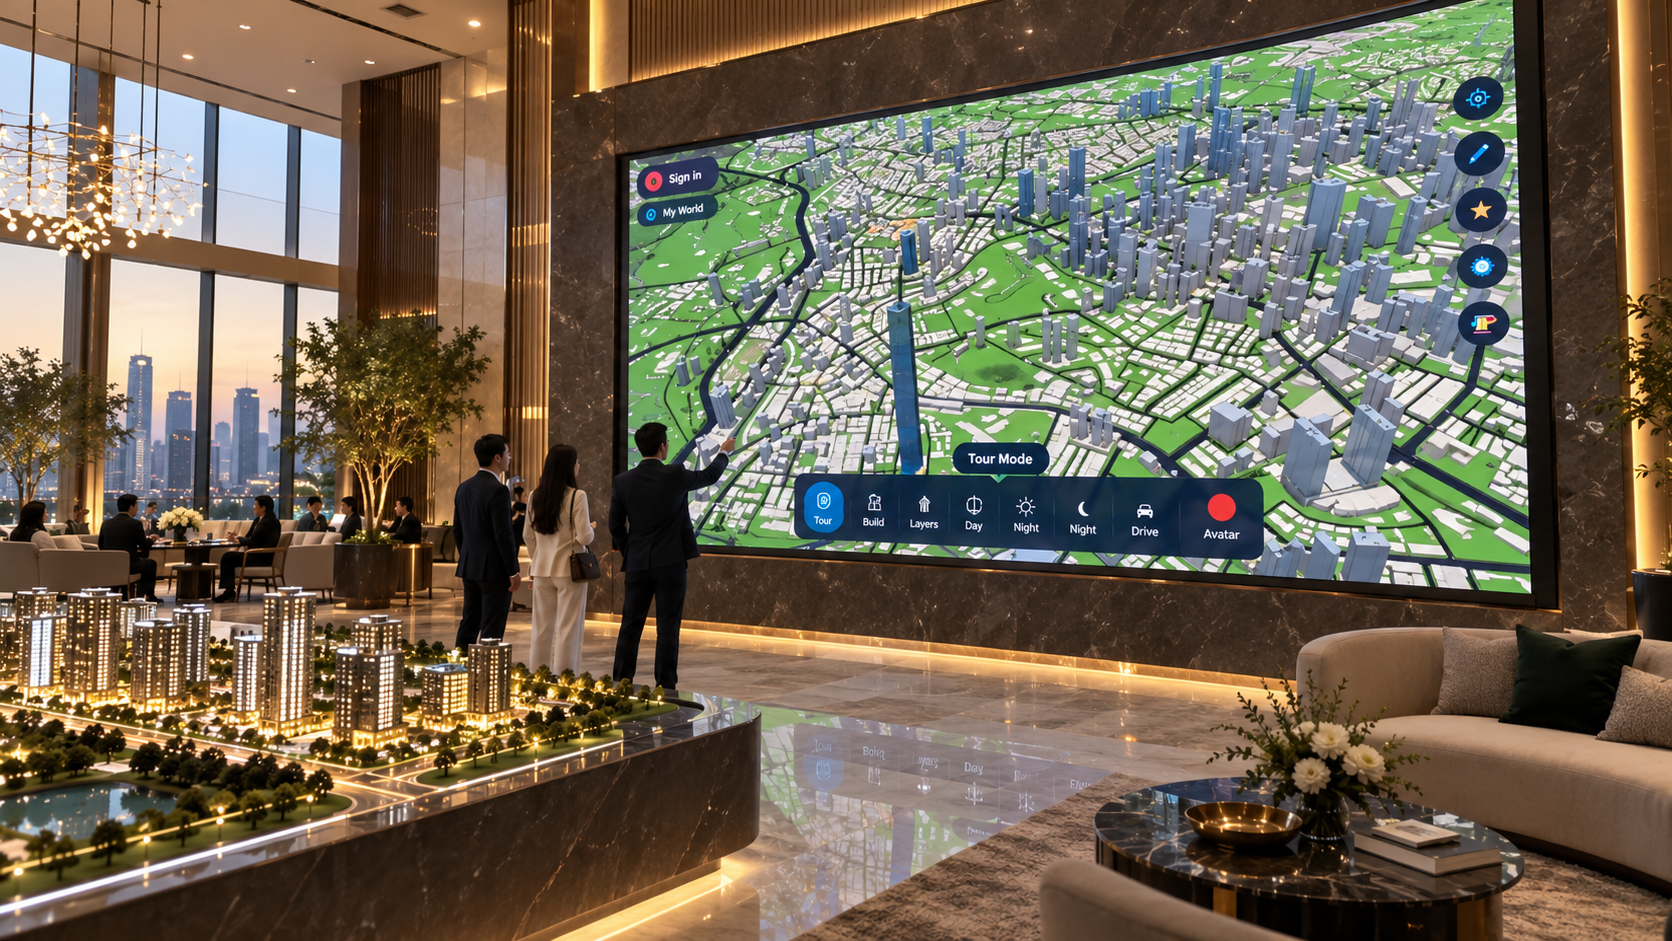
- Project locations and land parcels: map candidate sites, property boundaries, and development portfolios side by side.
- Nearby amenities and accessibility: show schools, healthcare, retail, parks, transit, and road access, with distances to the places that matter.
- Future infrastructure and competitor projects: place proposed stations, new roads, public investment, and comparable developments beside today's conditions.
- Catchment areas: outline the neighbourhoods, employment hubs, or visitor zones that could feed demand and make location trade-offs easier to explain.
TOURISM & TRAVEL AGENCIES
Tell the story of a destination in context
Help travellers see more than a collection of pins. Bring landmarks, neighbourhoods, routes, and useful place descriptions into one clear, explorable 3D map. Then guide a live presentation through the destination—zooming in on details and sharing the experience with your audience.
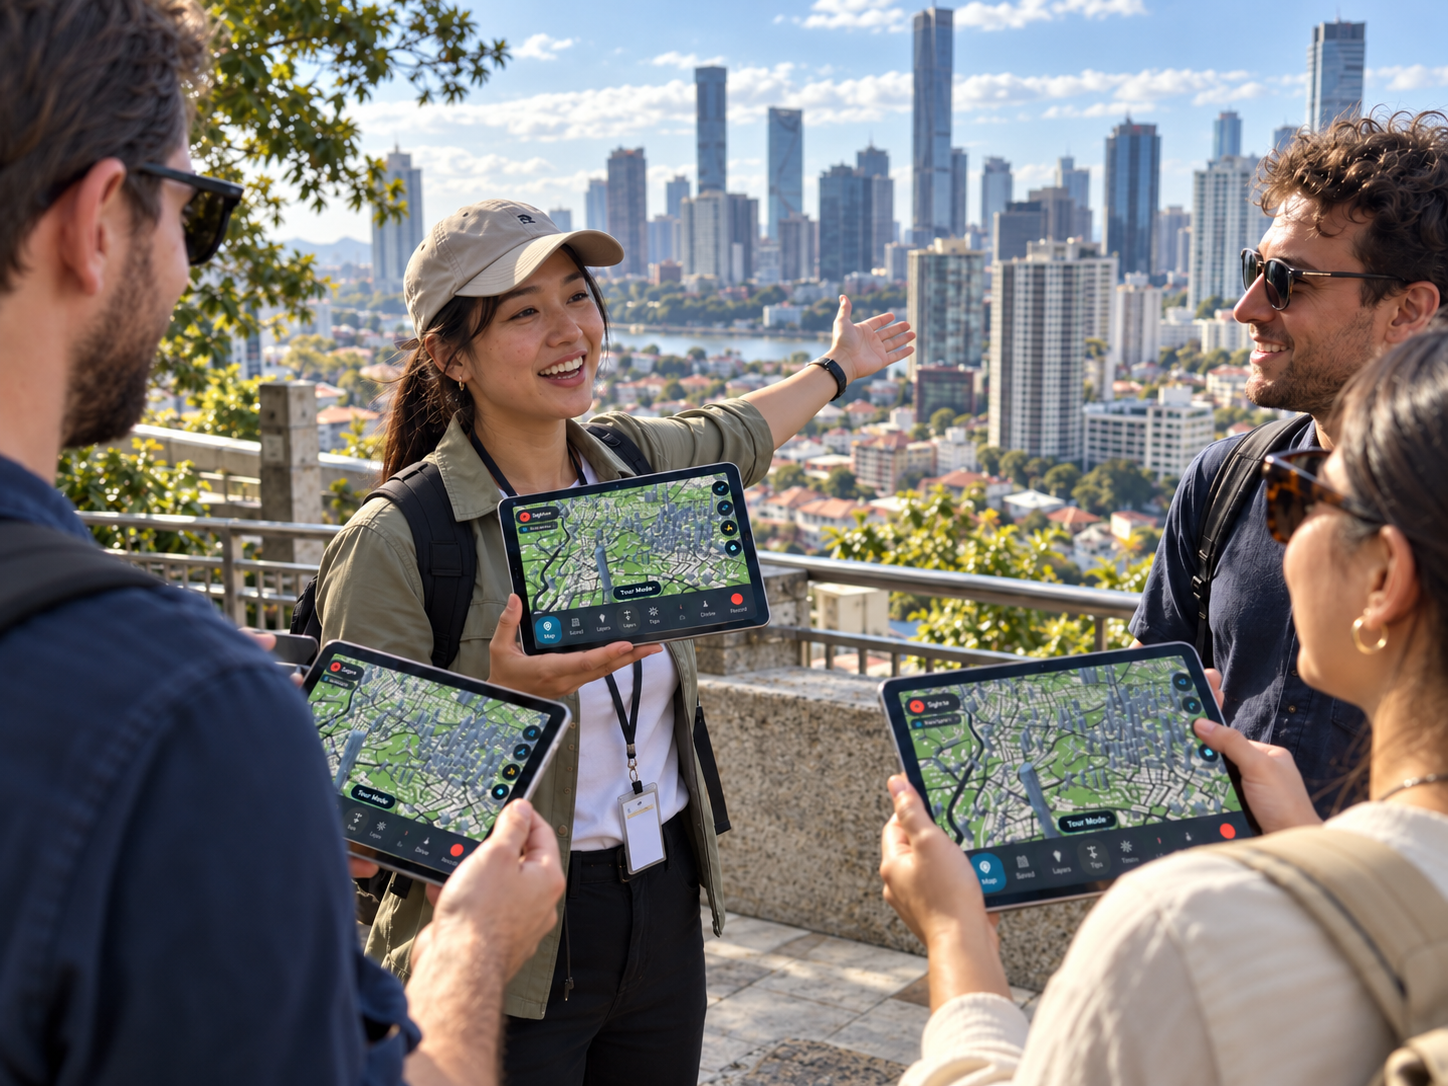
- Destination stories: pair landmarks and neighbourhoods with concise descriptions of local culture, history, and visitor details.
- The wider picture: connect attractions, accommodation, food, and transit so travellers can see where each stop fits into the destination.
- Live guided previews: lead an audience through an interactive 3D map, highlight stops, and discuss options together in a live session.
- Itineraries and alternatives: show included, optional, and alternate stops with the routes and local context behind each choice.
LOGISTICS & SUPPLY CHAIN
See how the network connects
Give operations and expansion teams a shared view of the facilities, corridors, and service areas that make up a supply chain.
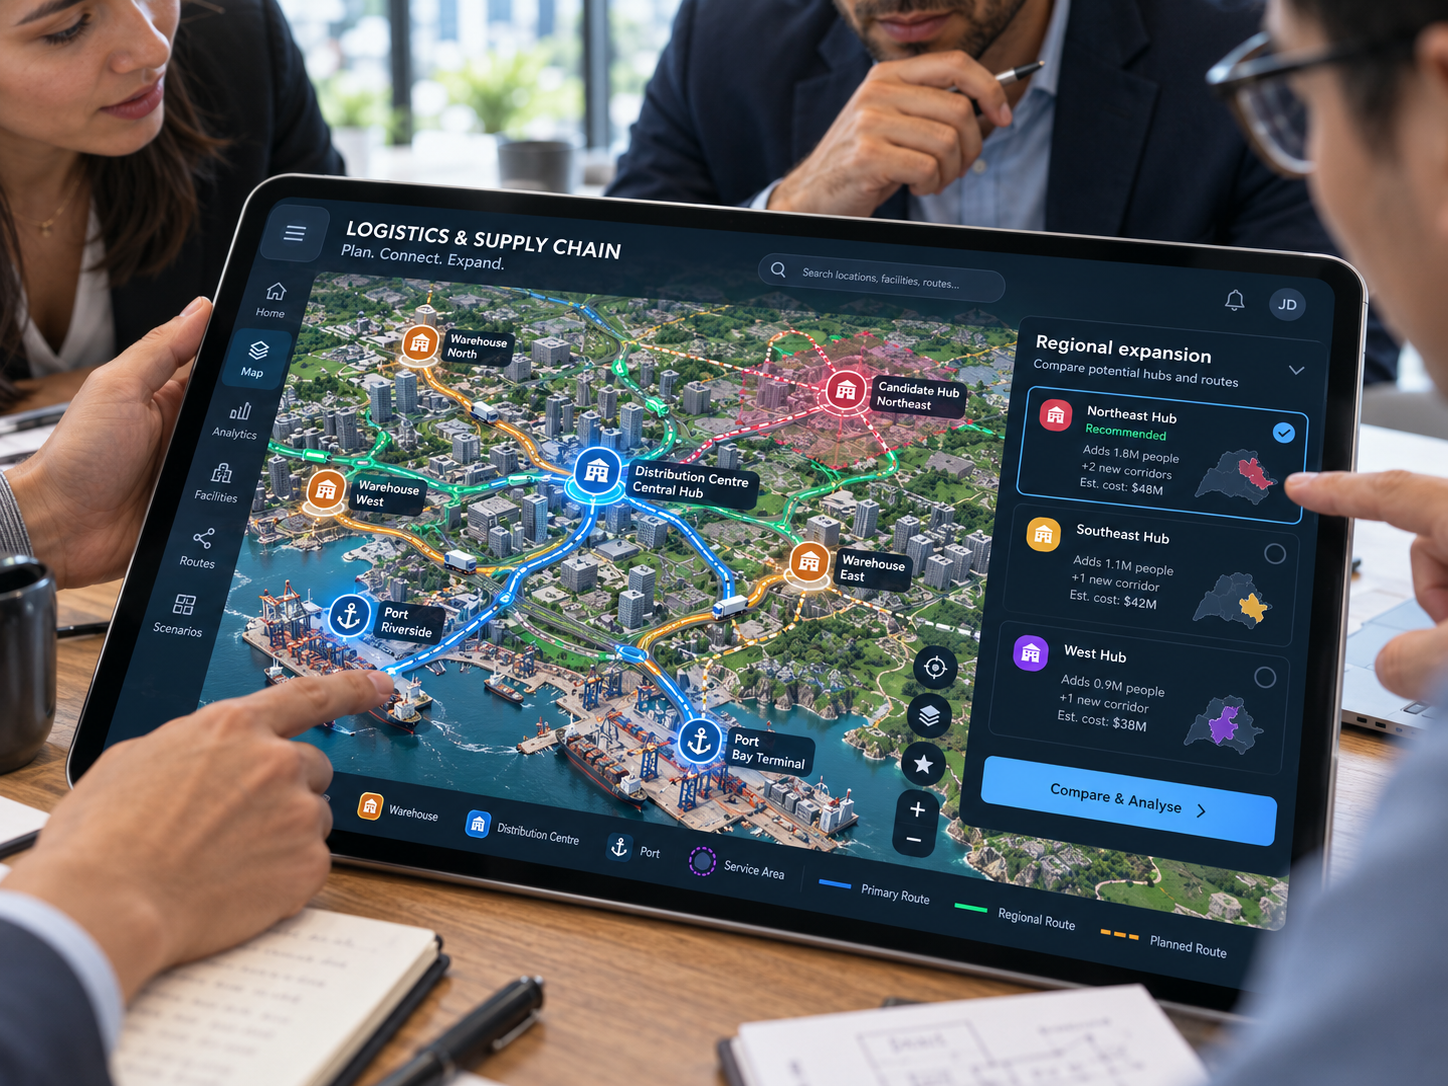
- Network nodes: locate warehouses, distribution centres, ports, and other facilities, then show how each connects to the wider network.
- Delivery coverage: outline service areas and make regions with limited coverage or long travel distances easier to spot.
- Transport routes and delivery times: map road, rail, or sea corridors and annotate observed or planned delivery-time bands from your own data.
- Regional expansion: compare potential hubs and routes to show which areas a new facility could add to the network.
URBAN PLANNING & ARCHITECTURE
Put a design proposal in its real setting
Explain how a site relates to the surrounding city. Bring a design, masterplan, or planning discussion into a visual context that stakeholders can explore.
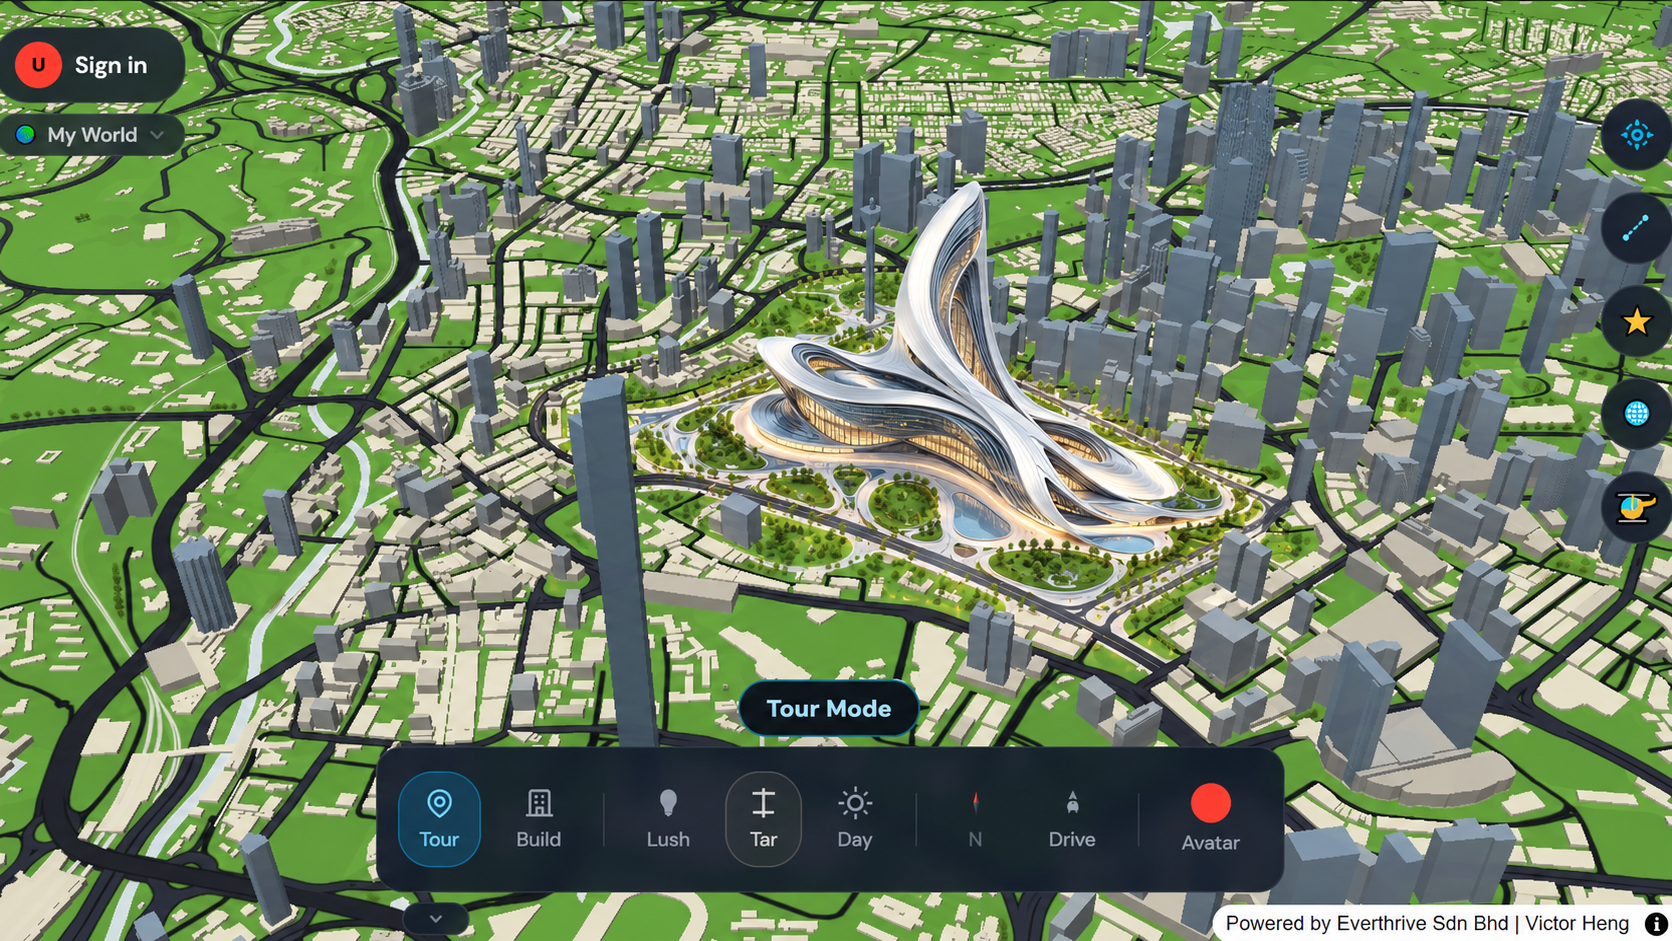
- Site context and zoning: present the site alongside surrounding streets, buildings, boundaries, and zoning information supplied by your team.
- Masterplans: show proposed blocks, public spaces, and development phases as a connected plan rather than an isolated drawing.
- Infrastructure connections: explain how a proposal relates to roads, transit, utilities, and other essential connections.
- Surrounding developments and accessibility studies: show adjacent projects, access routes, and the places people need to reach.
CONSTRUCTION & INFRASTRUCTURE
Make large projects easier to follow
Use a shared map to communicate where work is happening, what connects to it, and how a project changes across its phases.
- Highways, railways, and utilities: map linear infrastructure and explain how routes connect to sites and communities.
- Construction sites: locate active and planned works in relation to nearby roads, buildings, and services.
- Project phases: show the sequence of construction areas, milestones, or temporary access changes using information from the project team.
- Regional proposals: present proposed transport and utility projects together so their wider connections are easier to discuss.
RETAIL & FRANCHISE EXPANSION
Compare store locations before you expand
Help expansion teams compare proposed outlets with the existing network, local competition, and the customers they aim to serve.
- Existing and proposed outlets: map current stores alongside candidate sites to see how the network is distributed.
- Customer catchment areas: outline the communities and activity centres each location is intended to reach.
- Competitors and demographics: compare nearby competitors and demographic data supplied by your research team.
- Expansion territories: show priority markets and proposed territories to align franchise and retail growth discussions.
SALES & TERRITORY MANAGEMENT
Make market coverage visible
Give sales leaders and field teams a geographic view of who they serve, where activity is concentrated, and where the next opportunity may be.
- Sales territories: draw or display regional boundaries so account ownership and coverage are easy to understand.
- Dealer networks and client locations: map partners and customers in relation to the territories they support.
- Regional performance: compare sales or activity measures by area using your team's own performance data.
- Market coverage and white space: identify areas with limited representation, underserved accounts, or potential for new relationships.
TELECOMMUNICATIONS & UTILITIES
Explain where services reach—and where they can grow
Bring network assets and service areas into one view for teams planning upgrades, maintenance, and regional expansion.
- Network coverage and towers: show coverage areas alongside tower locations and the communities they serve.
- Fibre routes and pipelines: trace network corridors and explain their connection to neighbourhoods, sites, and other assets.
- Substations and service areas: locate key facilities and show the areas or customers connected to them.
- Planned expansion: compare current and proposed coverage to communicate where new infrastructure is intended to extend service.
GOVERNMENT & ECONOMIC DEVELOPMENT
Connect investment plans to the places they affect
Help public agencies explain development priorities and show how investment, infrastructure, and public services relate across a region.
- Development zones and investment corridors: map priority areas and the routes or districts that connect them.
- Infrastructure projects and industrial parks: show current and proposed projects alongside employment and logistics locations.
- Population distribution and public facilities: present population context with schools, healthcare, transport, and other public services.
- Regional communication: give residents, investors, and partner agencies a clearer view of how plans relate to local places.
CONSULTING & MARKET RESEARCH
Turn regional research into a decision-ready map
Give clients a clear way to explore where markets, competitors, customer groups, and investment opportunities meet.
- Regional market analysis: organise research by geography and make patterns easier to discuss with stakeholders.
- Demographic comparisons: compare regions using demographic indicators from the research team's chosen sources.
- Competitor locations and market entry: show incumbent locations, candidate regions, and the spatial logic behind an entry strategy.
- Investment opportunity maps: bring the evidence for promising areas into one view and make assumptions easier to review.
Start with the place. Build the story around it.
This is the world first 3D Map for Business Presentation that required geographical explanation. You can own locations, routes, and research to make a proposal or market easier to understand. Openmap is a visual communication tool; verify regulatory, demographic, coverage, access, and delivery-time data with the responsible source.
Should I use Google Earth & Google Map for the same purposes?
Google Earth and Google Map are two very different tools comparing to Openmap.live. Every tools serve their unique purposes to different group of people.
Google Earth - great for exploring, less suited to a tailored project presentation.
Satellite imagery and 3D detail vary by location. It helps you look around, but it isn’t designed to make your custom building and project context the centrepiece of a business presentation.
Google Map - great for finding places, not for shaping your pitch
It helps people search, navigate, and check reviews. But when you need to show how a property or proposal fits into its surroundings, a navigation-first map can leave your audience to piece the story together.
Openmap is an editable 3D Map main serving the purposes of Customisable 3D building for presentation that no other map tools can provide. The concept is based on real life needs from the businesses aspects, that helps business owners and presenters to highlight what to show, what to focus, what to emphasize anything that matters to the presentations.